Graphical Tools
There are a number of different graphical methods and tools for structural analysis. These help
designers quickly key in on important design considerations and structural behavior.
The most important and indispensible graphical tool for architects and engineers are free-body diagrams showing
loading and support reactions, and the assoicated shear, moment and in some cases deflection diagrams.
Shear, Moment and Deflection Diagrams
Purpose and Value
Loading diagrams, shear and moment diagrams, slope and deflection diagrams all provide graphical insight into the
relationship between each of these quantities. The provide a visual means for locating maximum demands,
rotations and deflections. This information can be used directly for design calculations or can be used to make
adjustments to the design to change the behavior of the structure and improve performance.
Conventions and General Method
Placeholder Table
|
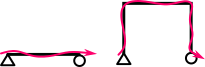
Work from Left to Right
Analyzing from left-to-right, clockwise for a consistent approach, to ensure the load effect diagrams are accurately represented at transition regions (internal joints, etc.)
|
 |
|
Positive Convention: External Loads
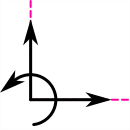
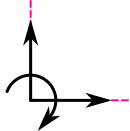
It's important to establish a positive convention for external (applied) loads. Loading upward and rightward is often considered positive.
In the US, positive moments and force-couples follow the right-hand-rule (CCW). In Japan, it clockwise (CW) moments are commonly considered positive.
|
 |
 |
|
Right-Hand-Rule
(US)
|
CW Moments
(Japan)
|
|
|
Equations of Equilibrium
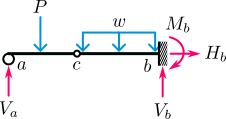
Setting up the equations of equilibrium should always be the first step. Treat the entire structure as a single rigid body and draw in the support reactions in positive sense.
|
 |
|
Positive Convention: Internal Load Effects
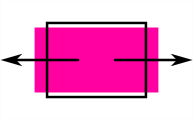
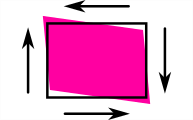
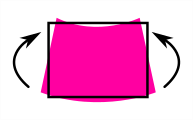
In both Japan and the US, it's common to consider the following positive:
- Axial tension (elongation)
- Shearing up to the left, down to the right (imagine CW spinning)
- Moment causing a smiley-face (downward bending)
|
 |
 |
 |
| Axial |
Shear |
Bending |
|
Determine Load Effects at Arbitrary Points
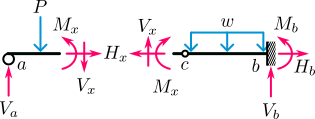
Once the reactions are determined, the method of sections can be used to determine internal load effects at any point x.
Plotting the load effect intensities at multiple points provides information to create axial, shear and moment diagrams.
|
 |
|
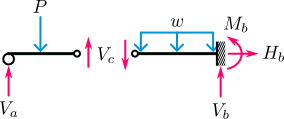
Smart Selection of Points
Sectioning at internal hinges, etc., can simplify analysis. We should also plot the determined values at boundary conditions (supports).
With an understand of the behavior between these points, we can speed up the process.
|
 |
Shear and Moment Diagrams
|
Shear Diagram Slope
The slope of the shear diagram at a point is equal to the load intensity:
$$\frac{dV}{dx}=w$$
|
 |
|
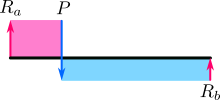
Concentrated Loads
Support reactions and applied point loads push the shear diagram in the direction of that load, by the same amount.
|
 |
|
Change in Shear Diagram
The change in the shear diagram is equal to the area under the loading curve:
$$\Delta V=\int{w(x)dx}$$
Initial conditions: Remember to add the shear amount occurring at the point where integral starts. This is the constant of integration.
|
 |
|
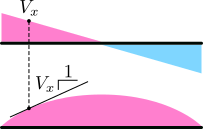
Slope of the Moment Diagram
The slope of the moment diagram at a point is the shear at that point:
$$\frac{dM}{dx}=V$$
|
 |
|
Change in Moment Diagram
The change in the moment diagram is equal to the area under the shear curve:
$$\Delta M=\int{V(x)dx}$$
Initial conditions: Remember to add the moment amount occurring at the point where integral starts. This is the constant of integration.
|
 |
|
Effect of Applied Moments
Similar to the effect of concentrated loads on a shear diagram, applied moments cause an instantaneous jump in the moment diagram at the point of application.
The value and sense of the jump is the magnitude and sense of the moment. (The illustration uses the RHR, where the applied moment is negative).
|
 |
|
Moment Diagram Convention
Based on the positive convention above, the positive moment diagram for a downward deflecting beam should be on the compression side.
However, it is common to arbitrarily draw the moment diagram on the tension face (“concrete convention”) where reinforcement will be necessary. This is commonly done in Japan.
Draw the deflected shape of the frame and it becomes easy to determine the tension face.
|
 |
|
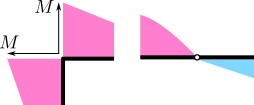
Corners and Hinges
Moment does not transmit through hinges or pin supports.
However, moment does transmit through rigid joints. At rigid joints the moment is the same at each side.
When there are more than two members framing into a rigid joint, it's helpful to think of the following relationship:
$$\sum{M_{in}}=\sum{M_{out}}$$
The distribution of moment is based on the stiffness of each branch at the joint.
|
 |
|
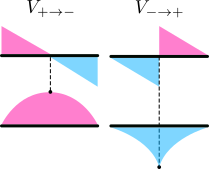
Loading Minimum and Maximum
Points where the shear diagram crosses 0 (whether sloping or jumping) correspond to a local maximum or minimum in the moment diagram.
When the shear diagram goes from positive to negative, there is a local maximum in the moment diagram. Conversely, negative to positive results in a local minimum in the moment curve.
|
|
Rotation and Deflection Diagrams
Rotation and deflection diagrams can often be developed based on similar relationships introduced with load,
shear and moment above.
|
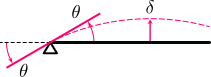
Positive Convention
Following the system outlined earlier (positive bending results in a smiley-face), positive rotation is counterclockwise (CCW) and positive deflection is upward.
|
 |
|
Bending, Slope and Deflection
Based on elastic beam theory, the change in rotation (slope) and deflection can be related to the moment.
$$\frac{d\theta}{dx}=\frac{M}{EI}$$
The deflection is the second derivative of the moment:
$$\frac{d^2\delta}{dx^2}=\frac{M}{EI}$$
Another way of looking at this, the deflection is related to the second integral of moment:
$$\delta=\frac{1}{EI}\iint{M(x)dx}$$
The constants of integration correspond to initial conditions of rotation and deflection, etc.
|
 |
Superposition
In cases with several complicated loading or support conditions, multiple simplified diagrams can be superimposed
to determine the resultant diagram. This is valuable for:
- Simplifying cases with confusing loading conditions into the sum if several simpler cases
- Analyzing statically indeterminant cases by resolving them into the sum of several determinant cases